Blogs/Manufacturing insights
Why most manufacturing lead time is waiting, not processing
A part that takes four hours of real work routinely takes four weeks to reach the customer. The gap isn't slow machines — it's queue time, and it follows predictable mathematics.
Trooba Team
In most high-mix, low-volume plants, the large majority of manufacturing lead time is waiting time, not processing time. The gap is not slow machines. It is queue time — the hours and days a job spends sitting in front of a resource, waiting for a batch to finish, waiting for a move, waiting for a decision.
This matters because most improvement budgets are aimed at the wrong number. If touch time is 5% of your lead time, cutting touch time in half improves lead time by 2.5%. Cutting the waiting is where the leverage lives. Trooba Flow, our Factory Flow Intelligence software, exists because that waiting is predictable. It follows the mathematics of queueing systems, and it can be modelled before you change anything on the floor.
The short answer: your parts spend most of their life in a queue
Two terms, defined plainly, before anything else.
Touch time (also called processing time or value-added time) is the time a job is actually being worked on. Metal being cut. Solder being applied. A stone being set. If you stood next to the part with a stopwatch and only ran it when something was happening to the part, that is touch time.
Queue time is everything else inside the plant. The job is on a rack, on a pallet, in a tote, in a WIP rack, or in a tray on a bench, and nothing is happening to it. It is waiting for a machine that is busy with another job, waiting for the rest of its batch, waiting for the forklift, waiting for a quality sign-off, waiting for the planner to release it.
Manufacturing lead time is the calendar time from when the order enters the shop to when it leaves as a finished, shippable product. It is the sum of touch time, queue time, and transport time.
In a job shop or a make-to-order plant, touch time is usually a single-digit percentage of the total. Not because anyone is lazy, but because that is what queueing systems do when you load them with variable work.
An illustrative worked example
The numbers below are illustrative, not a measured customer result.
A shop takes an order for 40 machined brackets. The routing is saw, mill, deburr, outside heat treat, inspect.
| Operation | Touch time per piece | Touch time for 40 pieces |
|---|---|---|
| Saw | 1.5 min | 60 min |
| Mill | 12 min | 480 min |
| Deburr | 4 min | 160 min |
| Inspect | 2.5 min | 100 min |
| Total in-house | 20 min | 800 min (13.3 hours) |
Thirteen and a bit hours of real work. On a single-shift, eight-hour day, that is under two working days of actual processing. The order shipped in 18 working days.
Bracket order · 18 working days elapsed · illustrative model
So roughly 9% of the elapsed time was touch time. The other 91% was the part sitting still. Three of those days were at the heat treat supplier, and most of that was queue too — just someone else's queue. This ratio is not unusual. It is the normal condition of a plant that runs a wide product mix through shared resources.
Where the waiting actually hides
If you go looking for the missing 91%, you find it in five places. They are not equally sized, and the mix differs by plant, which is why measuring beats guessing.
Why faster machines barely move the needle
Here is the arithmetic that surprises people. Take the bracket example. Suppose you buy a machining centre that cuts the mill operation from 12 minutes to 6 minutes per piece. Real improvement, real money.
Total in-house touch time drops from 800 minutes to 560 minutes — that is 4 hours saved, half a working day, against an 18-day lead time. Best case, you go from 18 days to 17.5 days, a 3% improvement, and only if nothing else in the queue structure changes.
In practice it can be worse than that. A faster machine at one operation feeds the next operation faster, and if the next operation is the constrained one, you have simply moved WIP downstream and grown the queue there.
The two forces that create queues: utilisation and variability
Utilisation is the fraction of available time a resource is actually busy. A machine running 7.2 hours out of an 8-hour shift is at 90% utilisation.
Variability is the unevenness in the system. Jobs do not arrive at even intervals. Setups differ. Some orders are 5 pieces, some are 500. Machines break. Operators are absent. Two kinds matter: variability in arrivals, and variability in processing times.
Queueing theory gives us the relationship between these and waiting. Kingman's formula, also called the VUT equation, expresses average queue time at a workstation as the product of three factors: a variability term, a utilisation term, and the average processing time. The utilisation term is ρ / (1 − ρ), where ρ is utilisation.
That fraction is the part every plant manager should internalise. Watch what it does:
| Utilisation | ρ / (1 − ρ) | Relative queue time |
|---|---|---|
| 70% | 2.33 | baseline |
| 80% | 4.00 | ~1.7× the 70% case |
| 90% | 9.00 | ~3.9× the 70% case |
| 95% | 19.00 | ~8.2× the 70% case |
The ρ / (1 − ρ) term, by utilisation
Same machine. Same operators. Same work content. Only the loading changed. Queue time does not rise gradually as you push utilisation up — it rises sharply, and it accelerates. The last few points of utilisation, the ones that look like free capacity on a report, are the most expensive points in the plant. This is why a shop that "finally got the mill to 95%" often finds that lead times got longer and expediting got worse in the same quarter.
The variability term matters just as much. Halve the variability in arrivals and processing, and you roughly halve the queue at that station, at the same utilisation. That is why setup reduction, standardised routings, and stable release rules pay off in lead time far beyond the minutes they directly save.
Little's Law: the check you can run this afternoon
Little's Law is the simplest useful relationship in operations:
Where WIP (work in process) is the number of jobs currently inside the system, throughput is the rate at which jobs leave, and lead time is the average time a job spends inside. Rearranged:
This is not a model or an approximation. It holds for any stable system, whatever the distributions.
Illustrative example. A finishing cell completes 20 jobs per day. Walk the floor and count what is physically in the cell: 200 jobs, on racks, in trays, in the queue at each bench.
Lead time = 200 ÷ 20 = 10 days.
Now suppose you release less work and hold WIP at 100 jobs, while the cell still completes 20 jobs per day. Lead time = 100 ÷ 20 = 5 days.
Nothing about the machines changed. The cell did not get faster. There was simply less work in front of each job.
The catch, and it is a real one: you cannot cut WIP arbitrarily and assume throughput holds. Drop WIP too far and resources starve, throughput falls, and lead time stops improving. Somewhere between "flooded" and "starved" is a WIP level that protects throughput while keeping queues short. Finding it by trial and error on a live floor is expensive. Finding it in a model is not.
Measure the waiting before you attack it
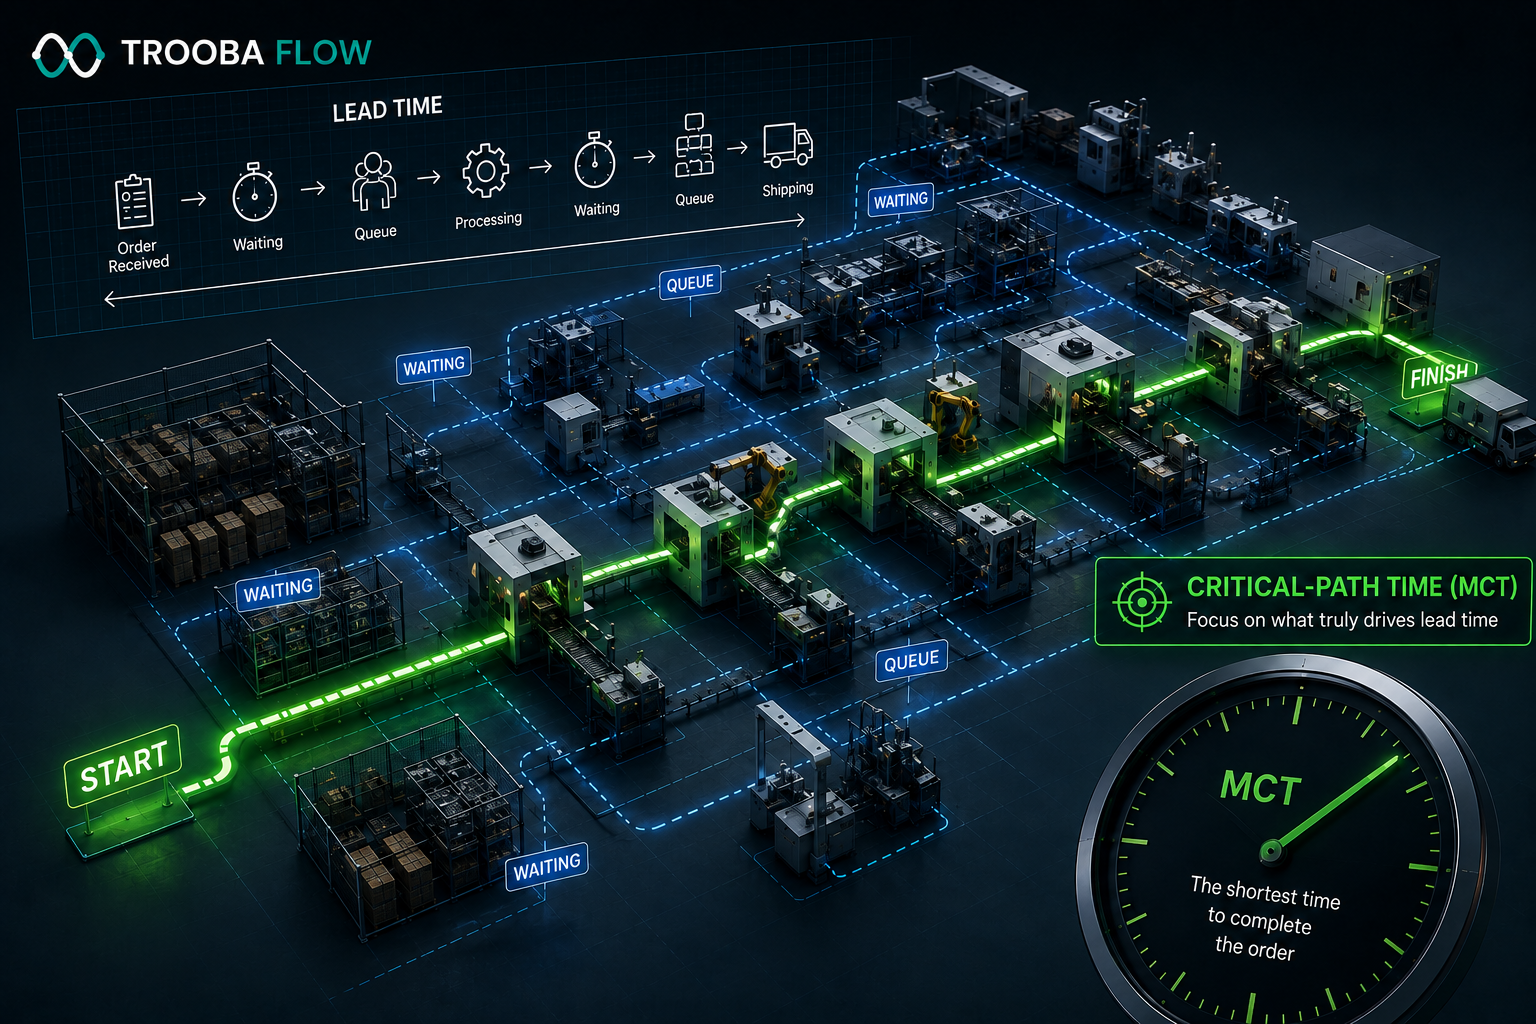
Quick Response Manufacturing uses Manufacturing Critical-Path Time (MCT) for this: the typical calendar time from when a customer order is created, along the longest critical path, until the first piece of that order is delivered. Calendar time, not working time. It counts the weekends, the overnight sits, the days a job spends in a rack while nobody logs anything.
MCT is deliberately unforgiving. It does not let you exclude the parts of the process where nothing happens, which is exactly where the lead time is.
A practical way to get your first honest number:
- Pick one representative product family. Not the easiest one, not the worst.
- Take three to five recent real orders in that family. Record the date the order entered and the date the first good piece shipped. Count calendar days.
- Sum the standard touch time for those orders from your routings, including setup, and convert it to calendar days at your actual staffing.
- Divide touch time by total elapsed time. That is your touch time ratio.
- Then walk the physical path of one job and write down every point where it sat still, and for roughly how long.
Most plants doing this for the first time land somewhere between 1% and 10% on step four, and are genuinely surprised by step five. The surprise is usually not the machine queues — it is the batch waiting and the decision waiting.
What actually reduces the waiting
Once you know the waiting is the target, the lever set changes completely.
| Lever | What it actually changes | Effect on queue time | Capital required |
|---|---|---|---|
| Faster machine | Touch time only | Small, unless it also lowers utilisation at the constraint | High |
| Extra shift / added capacity | Lowers utilisation ρ | Can be large, because of the ρ/(1−ρ) effect | Medium–high |
| Smaller transfer lots | Overlaps operations, cuts batch waiting | Often large, fast to see | Near zero |
| Setup reduction | Lowers variability, makes small lots economic | Large, compounding | Low–medium |
| Capped WIP / controlled release | Directly sets lead time via Little's Law | Predictable and immediate | Near zero |
| Cellular reorganisation | Cuts moves, handovers, shared-resource contention | Large, but disruptive | Medium |
The transfer lot lever deserves a worked example, because it is the cheapest and the most consistently ignored.
An order of 100 pieces runs through two operations. Operation 1 takes 2 minutes per piece. Operation 2 takes 3 minutes per piece.
Moving the whole batch vs. moving in transfer lots of 20
A 32% reduction. No new equipment, no extra labour, no process change. The only thing that changed was when material moves.
A measured example of the same principle
MEASURED RESULT — TARINIKA
Tarinika, a jewellery manufacturer, reduced manufacturing lead time using the same factory and the same machines. The constraint was lot sizing and queue dynamics, not machine speed.
The point is not the size of the number. Outcomes vary by system, product mix, and how much waiting was in the process to begin with. The point is where the reduction came from. No new equipment was involved. The improvement came from changing how work was batched and how it flowed between operations.
Modelling the change before you make it
Here is the uncomfortable part. Every lever in that table interacts with every other one. Cutting transfer lots increases the number of setups and moves, which raises utilisation at some resources. Adding a shift changes ρ at one station and moves the constraint to another. Reducing WIP shortens lead time until it starves a resource and throughput drops.
You cannot reason through these interactions reliably in a spreadsheet, and you should not learn them by experimenting on live customer orders.
This is the problem Trooba Flow was built for. It models the plant as an open queueing network of products, routings, resources, demand, and variability, and predicts bottlenecks, queue time, WIP, utilisation, and manufacturing lead time. You can run a what-if scenario — a shift change, a routing change, a smaller transfer lot — and compare projected outcomes before anything moves on the floor.
Those projections are modelled figures, not measured ones. We keep the distinction sharp, and so should you when you present numbers internally. A model tells you which changes are worth trying and roughly how much they should be worth. The floor tells you what you actually got.
See where the waiting sits in your own plant, and what the credible levers are.
Request a Flow AnalysisIn short
Lead time in a high-mix plant is mostly a queueing outcome, not a processing outcome. Parts sit far longer than they are worked on, and the sitting is caused by high utilisation, high variability, and large batches, in roughly that order of leverage.
Measure honestly
Get your real touch time ratio from recent orders, not an estimate.
Check Little's Law
See what your current WIP level is already committing you to.
Look at transfer lots
The cheapest, most consistently ignored lever.
Find decision delays
Look for waits nobody logs — approvals, sign-offs, missing info.
Treat 95% as expensive
The last points of utilisation cost the most in queue time.
Model before you move
Test changes in a queueing model before changing the floor.
And before you commit capital to a faster machine, check what fraction of your lead time that machine actually touches.
If you want to see where the waiting sits in your own plant and what the credible levers are, you can request a Flow Analysis at trooba.com/flow-analysis.
FAQs
What percentage of manufacturing lead time is actually processing time?
In high-mix, low-volume plants, touch time is typically a single-digit percentage of total lead time. The exact figure varies widely by industry, batch size, and product mix, so the only reliable number is your own. Take several recent orders, divide summed standard processing time by calendar days elapsed from order entry to shipment, and use that as your baseline.
Will buying a faster machine reduce my lead time?
Usually only slightly, unless that machine is also your most heavily loaded resource. A faster machine reduces touch time, which is the smaller share of lead time. It can help meaningfully if it lowers utilisation at a constrained resource, because queue time falls sharply as utilisation drops. If it just feeds a downstream queue faster, WIP moves and lead time barely changes.
What is the difference between queue time and lead time?
Lead time is the total calendar time from order entry to shipment. Queue time is one component of it: the time a job spends waiting rather than being worked on. Lead time also includes touch time and transport time. In most job shops, queue time is by far the largest component, which is why lead time reduction is mainly a queue reduction exercise.
Why do lead times get worse when the plant gets busier?
Because queue time is governed by utilisation in a non-linear way. Kingman's formula includes the term ρ/(1−ρ), where ρ is utilisation. Going from 80% to 90% loading roughly doubles that term. Going from 90% to 95% doubles it again. Each additional point of loading costs more waiting than the point before it.
Can I reduce lead time without reducing WIP?
Not if throughput stays constant. Little's Law states that lead time equals WIP divided by throughput, so with fixed throughput, lead time falls only when WIP falls. You can also shorten lead time by increasing throughput at the same WIP level, but for most plants controlling release and cutting WIP is the faster and cheaper route.
How do I know which waiting to attack first?
Walk one real job end to end and record every point where it sat still and for how long. Rank those delays by duration. Most plants find the largest blocks are batch waiting and decision or approval waiting, not machine queues. Attack the largest block first, then re-measure, because fixing one delay often shifts the constraint somewhere else.
See what your utilisation targets are doing to your lead time.
Request a Flow Analysis