01
Add a shift at Assembly
Adds costLead time6.6 d
Change−21%
Trade-offAdds cost

Trooba is an AI-powered Factory Flow Intelligence platform that helps manufacturers identify bottlenecks, predict operational outcomes, and improve production performance.
Routing · projected utilisation and queue
Illustrative model of a four-operation plant.
Routing · projected utilisation and queue
Lead time by operation
Moving part of the Assembly load to a line the routing can already reach takes Assembly from 91% to 80%. Processing time does not change at all — every day saved is a day of waiting removed.
Every screen answers three questions in the same order: what is happening, why, and what to do about it.
OverviewIllustrative modelWhat is happening
Assembly is predicted to become the next constraint.
Why
Demand mix is shifting toward products that need more Assembly time.
Work arrives from Lathe in large transfer lots, in bursts rather than steadily.
What to do
Move part of the Assembly load to a second qualified line.
Bottleneck RadarIllustrative modelWhat is happening
One resource crosses the review threshold in the next ten days.
Ranked on projected queue behaviour, not on utilisation alone. A resource at 81% with steady arrivals can run calmer than one at 74% receiving work in bursts.
| Resource | Projected utilisation | Projected queue |
|---|---|---|
| Assembly | 91% | 3.2 d |
| Lathe · Line 2 | 81% | 0.8 d |
| Lathe · Line 1 | 74% | 0.6 d |
| Milling | 62% | 0.3 d |
| Packing | 58% | 0.2 d |
| Slitting | 41% | 0.1 d |
What-if StudioIllustrative modelWhat is happening
The change that costs nothing is the largest one.
Three scenarios against the same model. Moving part of the load to a line the routing can already reach takes Assembly from 91% to 80% utilisation — and buys more lead time than paying for a second shift.
Add a shift at Assembly
Adds costHalve the transfer lot at Lathe
Adds setupsMove part of the load to a second line
No added capacity| Scenario | Lead time | Change | Trade-off |
|---|---|---|---|
| 01 Add a shift at Assembly | 6.6 d | −21% | Adds cost |
| 02 Halve the transfer lot at Lathe | 5.9 d | −30% | Adds setups |
| 03 Move part of the load to a second line | 5.1 d | −39% | No added capacity |
Flow & QueueIllustrative modelWhat is happening
Three quarters of lead time is waiting, not work.
Lead time is decomposed operation by operation into processing, waiting and batching — so the argument is about where the time goes, not whether it is there.
CapacityIllustrative modelWhat is happening
One line has capacity the routing can reach and is not using.
Before capital goes into a machine, the model shows what is already available and what would have to change — a routing, a qualification, a setup — to reach it.
Trooba Flow. Figures throughout are from an illustrative model, not a customer result.
28 → 7 days
>75% reduction in manufacturing lead time · same factory, same machines
The constraint was not machine speed. It was lot sizing and queue dynamics — the way work was moving through the system.
Tarinika · jewellery manufacturer ·
multi-SKU, make-to-order.
Tarinika is the founder’s
manufacturing company.
Products, routings, resources, demand and variability.
See where queues, constraints and lead time emerge.
Test changes before making them on the factory floor.
Trooba models how demand, variability, routing and resource loading interact to create queues and lead time. AI explains the model. The mathematics grounds it.
Queueing, utilisation, and manufacturing critical-path time — written for people who run plants.
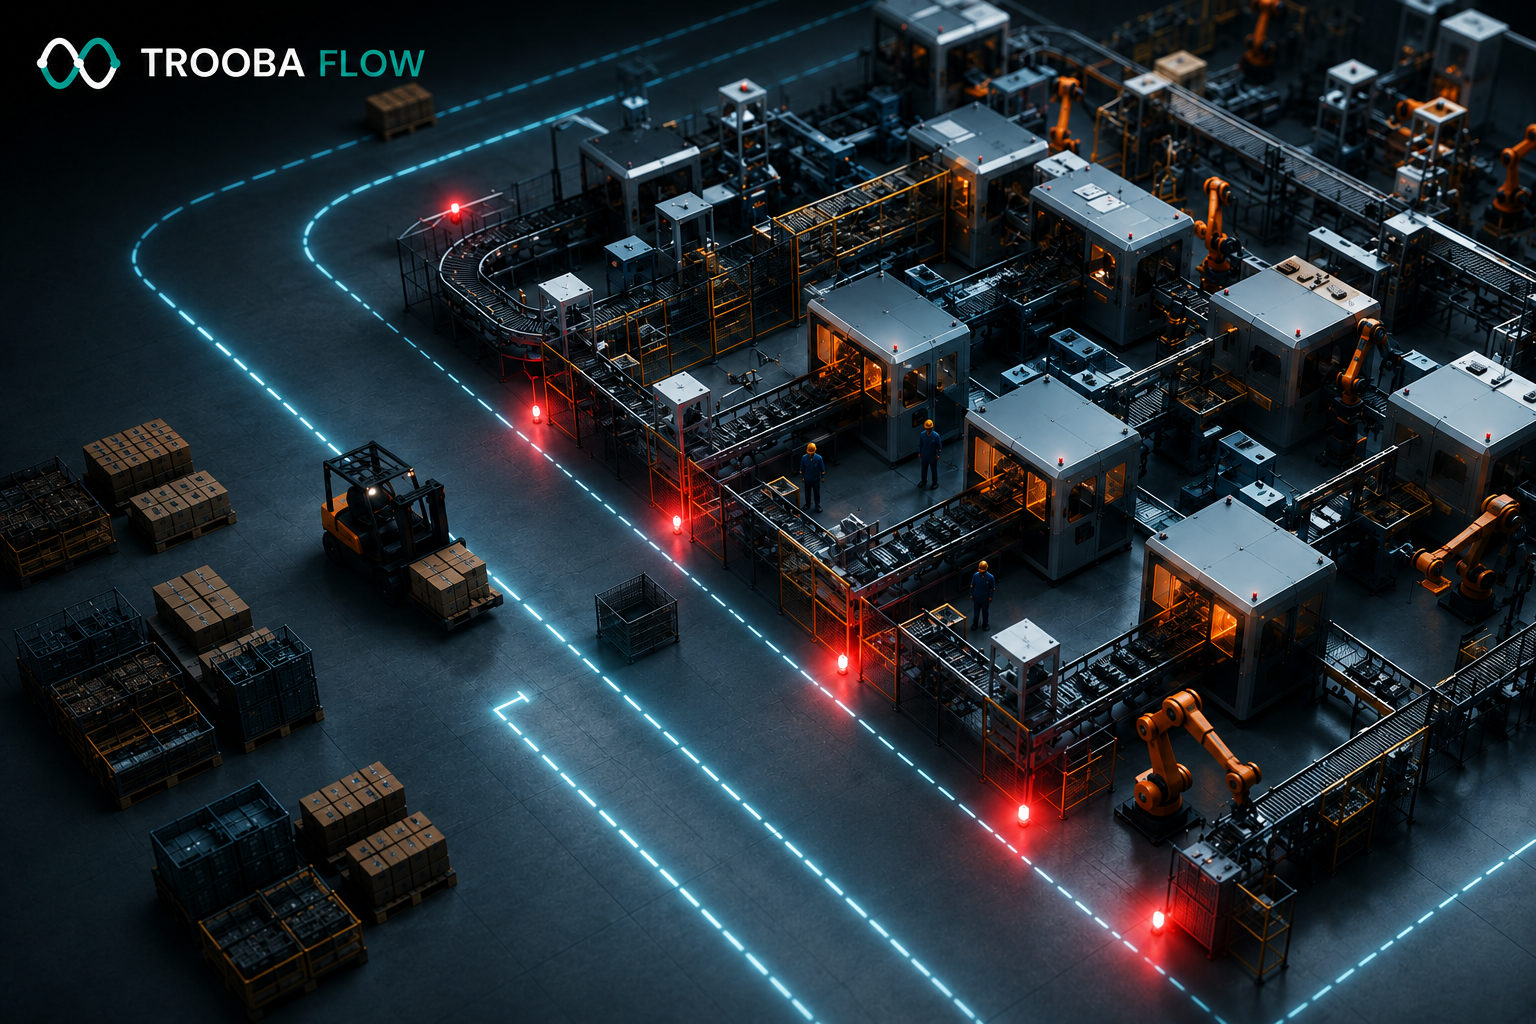
High machine utilization increases lead time by inflating queue time. Above roughly 85% utilization, waiting stops rising gently and starts rising steeply.
Read article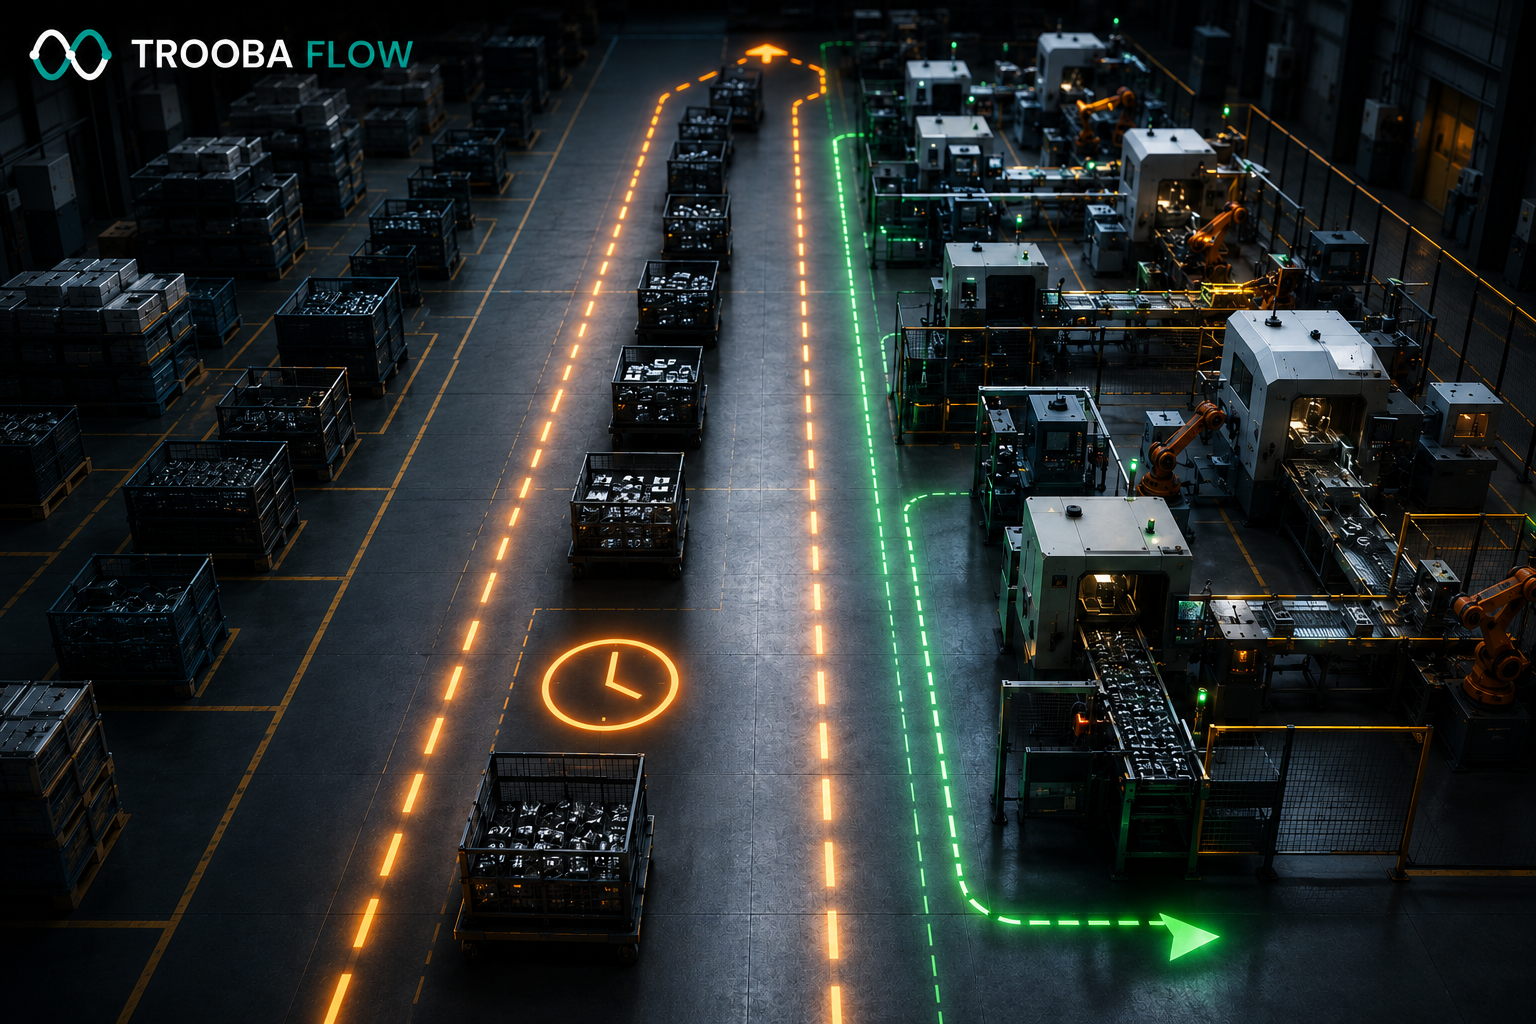
A part that takes four hours of real work routinely takes four weeks to reach the customer. The gap isn't slow machines — it's queue time, and it follows predictable mathematics.
Read article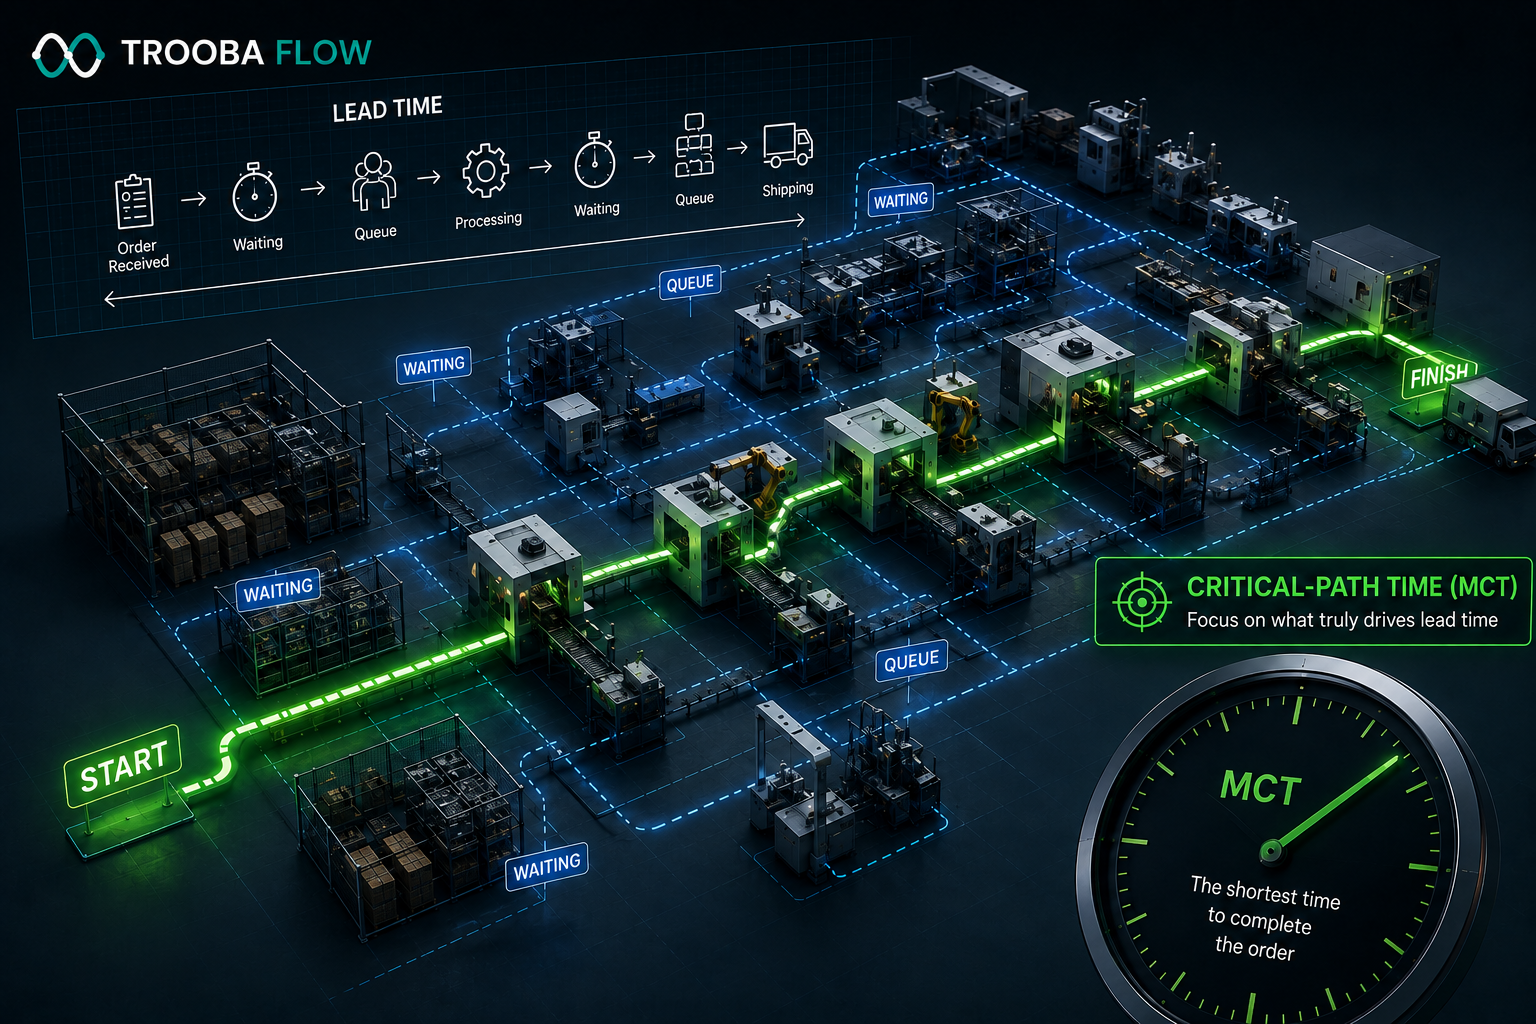
MCT counts every calendar day an order truly takes — weekends, waiting, approvals, outside processing — from order entry to first piece delivered.
Read articleShare a small set of factory data and see where queues, bottlenecks and hidden capacity are affecting performance.