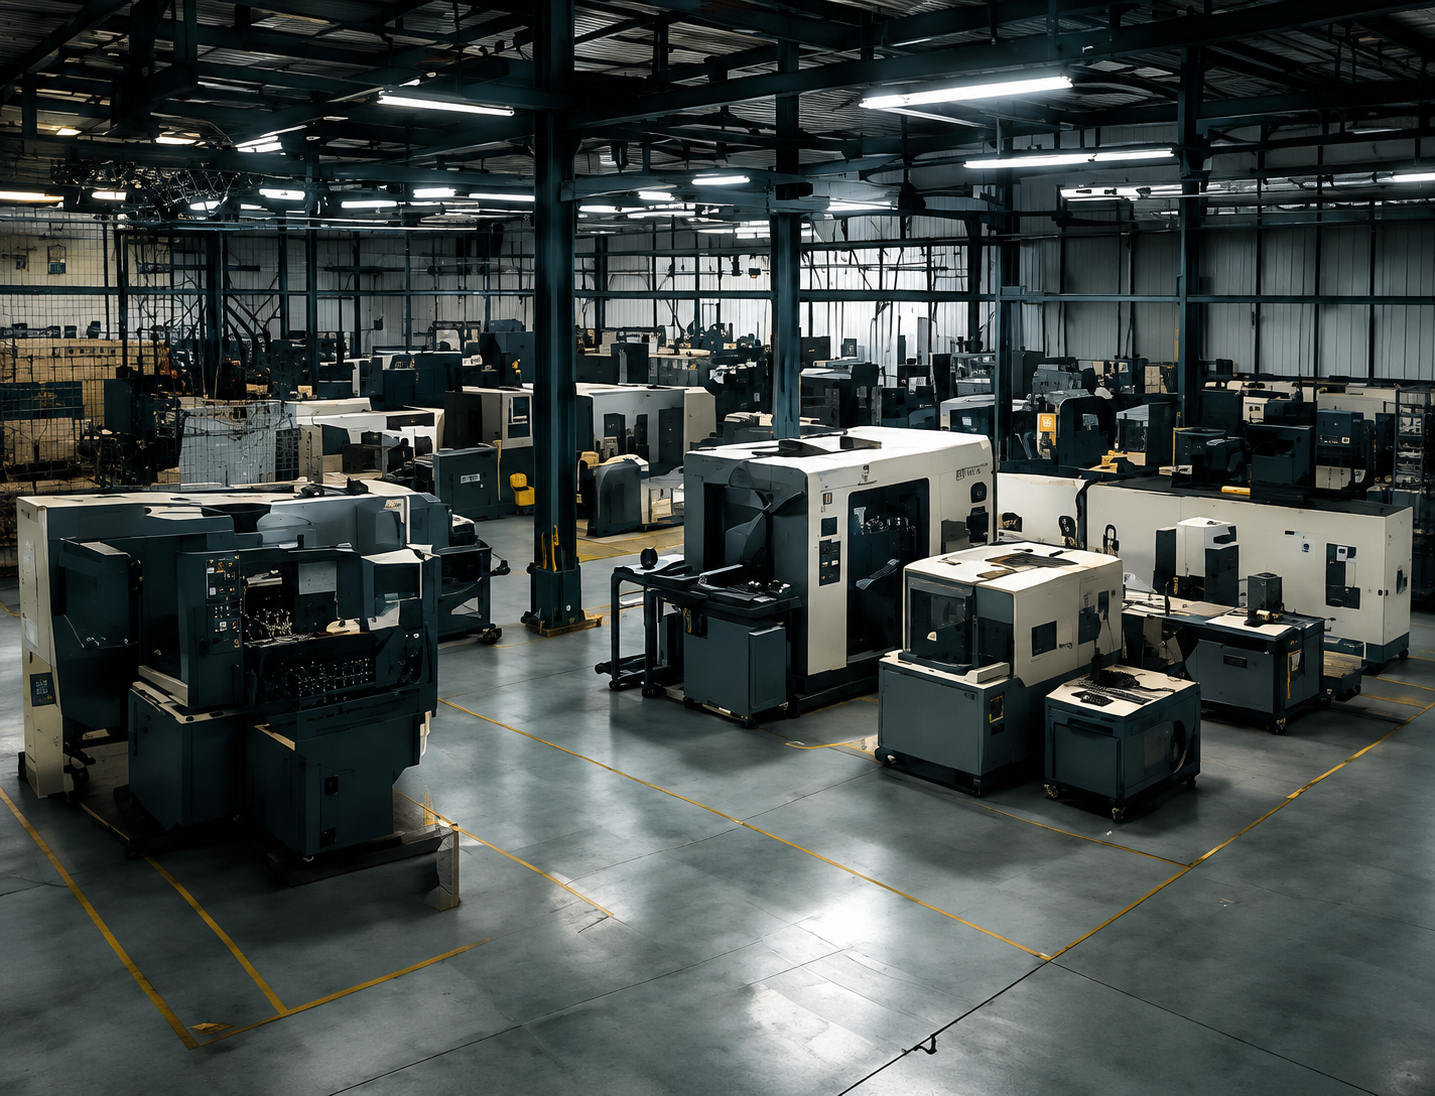
Jewellery manufacturer. Multi-SKU, make-to-order, several hundred active SKUs.
The problem
Manufacturing lead time of about four weeks, order to ship, while production capacity was available. Adding capacity had not fixed it.
What the analysis revealed
The constraint was not machine speed or nominal capacity. Lot sizing and queue dynamics were driving lead time.
What changed
Lot sizing and the way work was released and moved through the system. Same factory, same machines.
Result
Make-to-ship reduced from 28 days to 7 days — a reduction of more than 75%.
“We were solving for the wrong
thing.” Tarinika is the founder’s manufacturing company.
We state that rather than presenting this as an arm’s-length customer result — the
measurement is real, and so is the relationship.
Case 02 · In progress · Modelled scenario
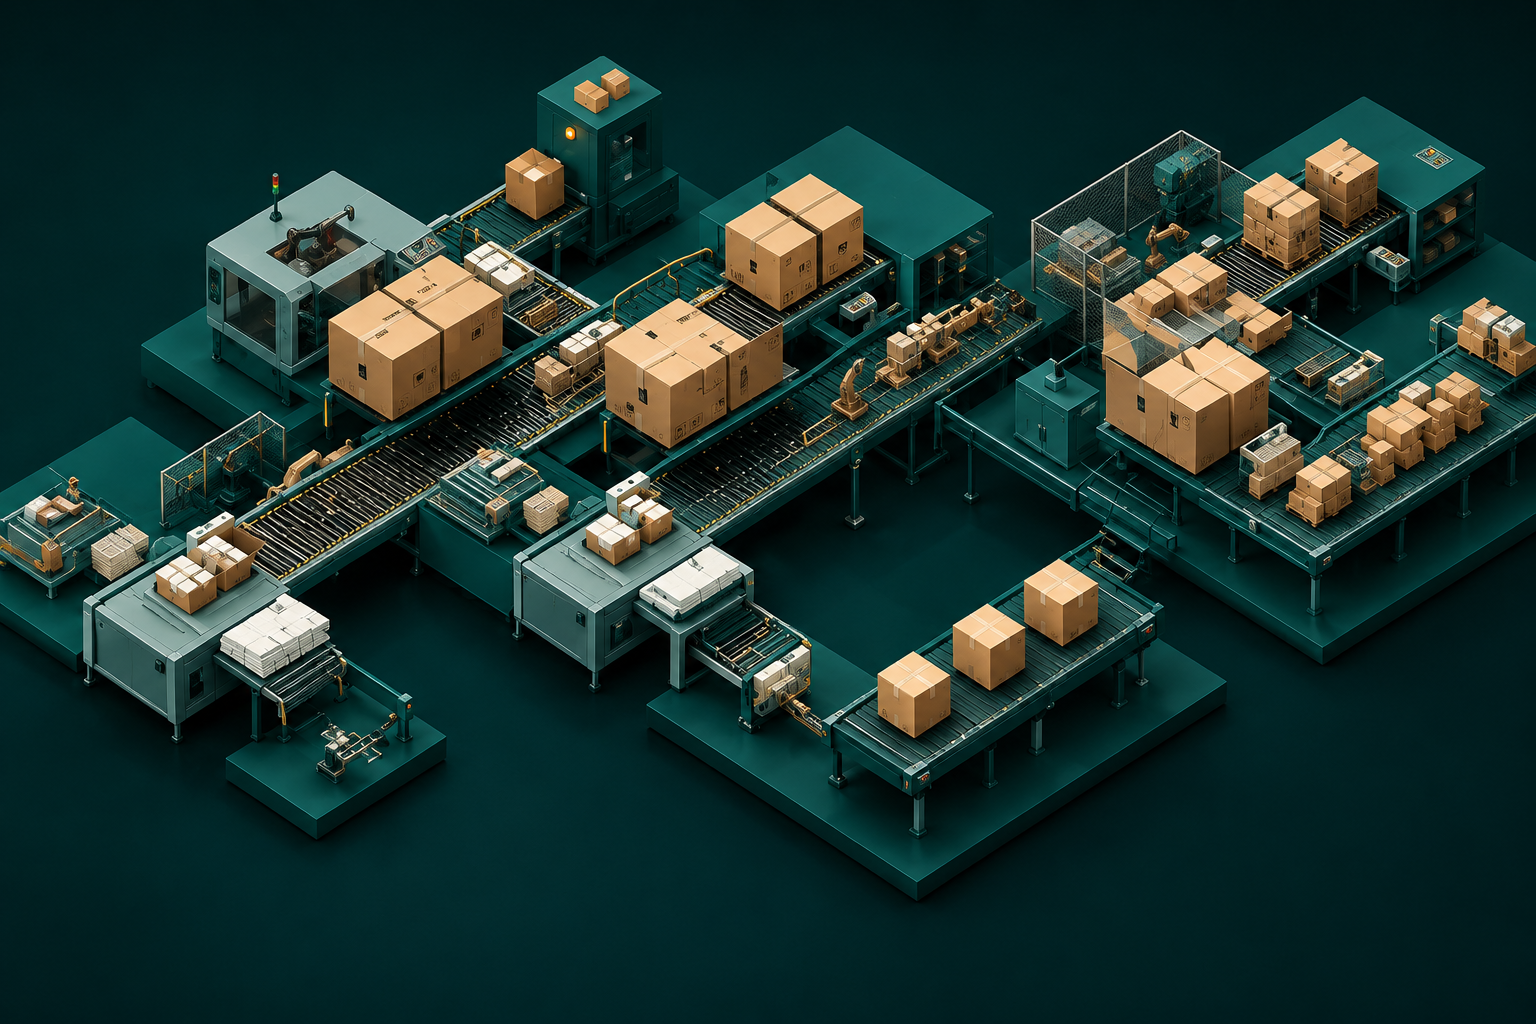
High-mix packaging manufacturer
A design partner running a high-mix, low-volume
packaging plant: orders arriving late while capacity was not the visible constraint.
What Trooba modelled
The plant’s observed routings, grouped
into product families. Machine pools containing unlike machines, labour shared across
operations, and low-volume adhoc jobs carried at their real variability rather than folded
into an average.
How the data was collected
Structured shop-floor collection run
by the plant’s own team — job travellers, work-centre snapshots, downtime logs
and resource registers — rather than an ERP export alone.
What the model showed
The delay was not where utilisation was
highest. It was in queueing created by batch policy, shared-resource contention and the
variability that low-volume work pushed into operations sized for steady demand.
Status
Model built and validated against observed flow.
Scenario testing under way. Everything this engagement has produced so far is a
modelled projection, not a measured outcome. Before-and-after results will
be published here once the changes have run on the floor and been verified — not
before.
Evidence
Measured and modelled are not the same word.
A measured result was observed in a factory after a change was made. A modelled result is what the model projects if a change is made. Both are useful. Presenting the second as the first is how manufacturing software earns the reputation it has.
Everything on this site is labelled. Every figure the product shows can
be traced to the model that produced it, and the model can be opened and argued with.
Run the same analysis on your plant.
One product family, your routings, your demand mix.